Key points
- Climate projections help us to understand what our future climate could be under different emissions scenarios.
- However, climate projections are affected by uncertainty about emissions scenarios, uncertainty about how our climate behaves and uncertainty in climate models.
- The limitations of climate models need to be understood to use and communicate about NARCliM regional climate projections appropriately.
Understanding climate model limitations
NARCliM is the best source of information we have to understand what NSW’s future climate might be like. However, the limitations of climate models need to be understood to use and communicate about NARCliM projections appropriately.
Uncertainty
We know our climate has changed as a result of human activities and that it will continue to change. We know that climate change is affecting weather events such as drought, heatwaves, severe bushfire weather days, intense rainfall and floods. We also know that increased greenhouse gas emissions are causing warmer global temperatures. However, we don’t know what exactly our future climate will be. This ‘not knowing’ is referred to as uncertainty. Understanding uncertainty helps you understand and communicate about climate change.
There are 3 main sources of uncertainty in climate projections.
Our climate is highly variable, and it is difficult to predict how exactly it will behave in response to natural processes such as El Niño and La Niña events.
Climate models manage uncertainty by using the best available climate science. However, our climate is driven by complex interactions in the physical world, and this complexity can’t be fully captured in a computer model. This means we cannot be certain that a climate model will exactly reflect our physical climate.
Different socioeconomic, technological and climate policy choices will result in different levels of greenhouse gases in the atmosphere. We can’t be certain that the emissions scenario used in a climate model reflects what will actually happen.
Addressing uncertainty
To help address uncertainty, NARCliM is built on a selection of emissions scenarios and global climate models that, together, capture a range of climates that could plausibly occur (see the NARCliM modelling methodology). The NARCliM2.0 model ensemble is made up of different combinations of 5 selected global climate models and 2 regional climate models, giving 10 model combinations in total across the 3 emissions scenarios (30). This is referred to as the NARCliM model ensemble.
Combining multiple models through averaging and other statistical methods produces better projections by providing a comprehensive range of possible future climate scenarios. Unless specified, presentation of data in the climate change snapshots is averaged across a 20-year period from the NARCliM model ensemble. For example, the projections for 2050 represent averaged data for 2040–2059 and projections for 2090 represent averaged data for 2080–2099.

The graph above shows the historical and projected temperature change for NSW, available in the NSW Statewide snapshot. The climate change projections presented in the graph above are relative to the historical climate baseline of 1990–2009. They provide a projected annual average of the NARCliM model ensemble (30 model combinations) for the 3 emissions scenarios SSP1-2.6 (low-emissions), SSP2-4.5 (medium-emissions) and SSP3-7.0 (high-emissions). The range of plausible climate futures across the NARCliM model ensemble is shown by light shading. A blue colour for the low-emissions scenario, an orange colour for the medium-emissions scenario and a dark red colour for the high-emissions scenario.
The table below shows the ensemble average for the period as the bold number. Underneath the average is the ensemble range. Temperature increases are additional to the historical model baselines of 17.6̊C for average temperature, 23.7̊C for average maximum temperature and 11.9̊C for average minimum temperature.

To ensure that NARCliM models adequately simulate regional climate, scientists use them to simulate the past climate and compare the results with actual observations. For historical climate data, both recorded observational data (dark line) and modelling of the past climate in NARCliM2.0 (grey) are presented in the graph above. Specific information, including additional variables, can be found in the NSW Statewide Snapshot.
Climate scientists also identify and reduce sources of uncertainty in the NARCliM project through testing and validation. Find out more about uncertainty in climate projections and confidence in projections.
Usage limitations: What NARCliM can’t do
At their time of release, all NARCliM projections capture a range of plausible future climates. Plausible means that these future scenarios are well within the bounds of possibility, given the uncertainties that exist. That is, plausible futures occur within a narrower range of the much wider range of possible futures. Importantly, both plausible and possible are different to probable, which are scenarios that are likely to happen. Because of uncertainty, climate projections cannot say what will probably happen.
NARCliM projections broadly describe the range of climate conditions that we can expect to plausibly occur in the future. They can’t tell us with certainty what our future climate will be like, at each specific location and point in time. In other words, while NARCliM projections won’t be able to tell you what conditions you can expect on a given day, they will tell you what to be prepared for based on a range of scenarios that may occur between now and 2100.
Currently, NARCliM projections don’t provide information about compounding and interacting hazards. However, they can be used appropriately in risk assessment projects, when paired with expert knowledge on compounding hazards and risks and well-designed analyses.
Appropriate use
Understanding sources of uncertainty in climate projections is an important part of using NARCliM appropriately and communicating your results.
Use a range of projections
For most projects, it’s best to use a range of projections. Planning for multiple plausible future climates means that you are more likely to be prepared for one similar to what occurs, as well as for increased climate variability.
Consider other aspects of climate risk
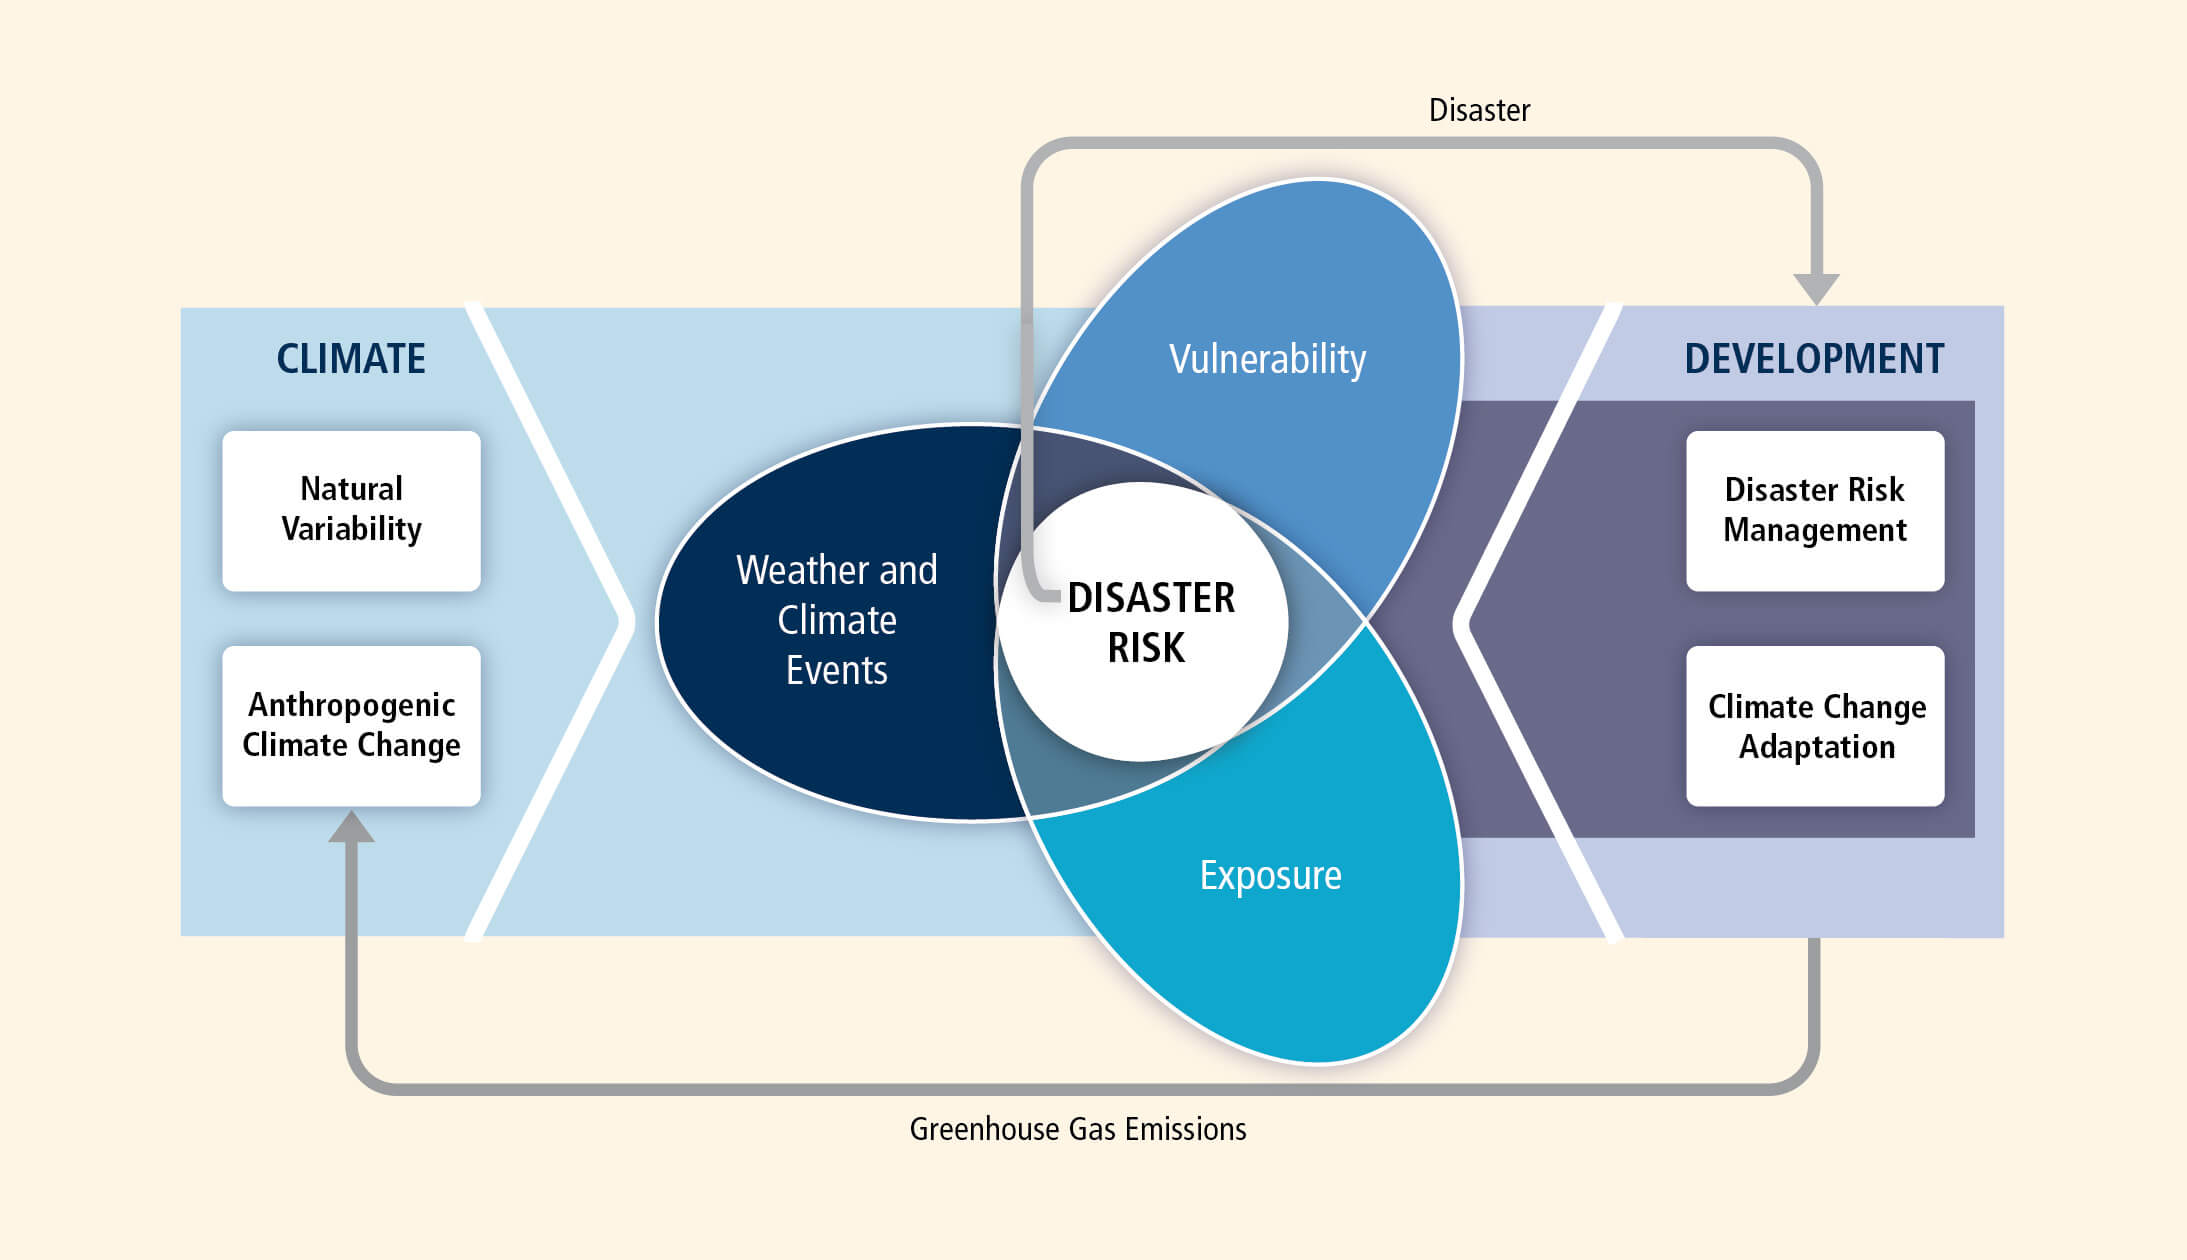
The Intergovernmental Panel on Climate Change (IPCC) describes the key aspects of risk as being hazard (climate events), exposure and vulnerability, along with risk response. Climate projections tell us about future climate events, including plausible exposure levels. However, they don’t provide information on vulnerability (for example, how vulnerable a particular asset or area may be based on its infrastructure or demographics). To understand and assess climate risks, climate projections need to be combined with data on other aspects of risk, such as vulnerability.
Find out more about mistakes to avoid when using climate model data.
Interpret and communicate your insights effectively
After you’ve analysed the NARCliM data you have decided to use, you’ll need to interpret the results in the context of your project and communicate the outcomes to your stakeholders. Alongside the results, you should communicate:
- the limitations of the projections, including explanations of uncertainty and how it was managed
- the NARCliM data used and why they were chosen
- the sources of any other data used in the project and why they were chosen
- any other limitations associated with the data or project design.
To ensure accuracy and consistency, reproduce the words and visual elements from existing NSW Government published resources wherever possible. For example, you can use the maps from the NSW regional climate change snapshots with the same published wording, and use the language from the AdaptNSW website where appropriate.
If your project is for a state or local government agency, you will also need to address any specific communication needs it has. Many agencies have standard wording and templates for climate data projects, such as climate risk assessments. Check what is available and provide your results in the format the agency requires.
Any projects using NARCliM data must acknowledge NARCliM as the data source. Find out how to acknowledge NARCliM data on the NSW Climate Data Portal.
To ensure that NARCliM models adequately simulate regional climate, scientists use them to simulate the past climate and compare the results with actual observations. For historical climate data, both recorded observational data (dark line) and modelling of the past climate in NARCliM2.0 (grey) are presented in the graph above. Specific information, including additional variables, can be found in the NSW Statewide Snapshot.
Climate scientists also identify and reduce sources of uncertainty in the NARCliM project through testing and validation. Find out more about uncertainty in climate projections and confidence in projections.