About this case study
Reduced rainfall, increased temperatures
State and local government
Advanced
Climate change creates a significant risk to infrastructure, people, and the economy. The impacts from climate change, including damaging weather events, has already cost the state an estimated $3.6 billion per year. For NSW transport planners and asset managers, there is pressing need to reduce climate risks and impacts on physical assets. One of the ways they’re doing this in NSW is by understanding future climate risks so that they can build more resilient transport infrastructure.
‘Climate risk is a game changer for NSW transport.’
Chris Royal, Director Sustainability at Transport for NSW, explains that climate risk assessment is not a separate standalone project for NSW, but that it now forms an integral part of projects. He says, ‘Climate change risk assessment informs the planning and delivery of transport infrastructure projects in an iterative process. In this way, we are building climate-resilient approaches into our decisions.’
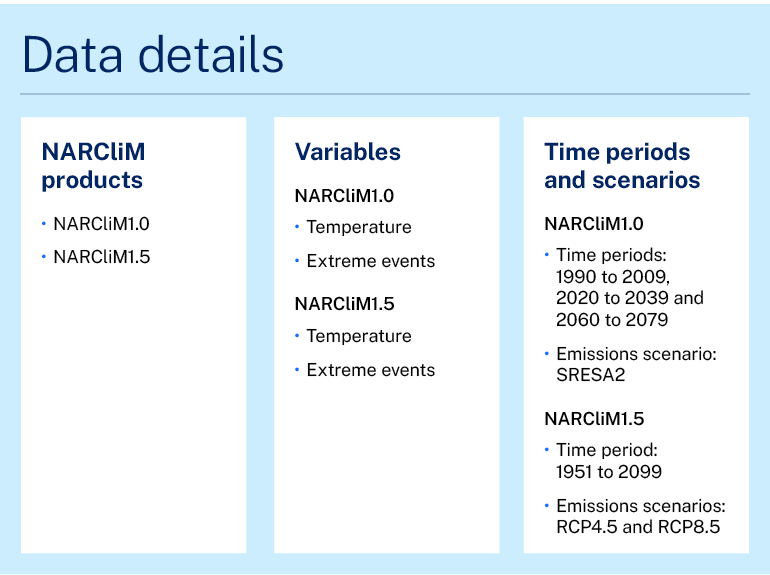
A vital input to the climate change risk assessments are NARCliM climate modelled data. This data includes locally-relevant climate projections to the year 2099, helping Chris and his team better understand and manage climate change risks and opportunities.
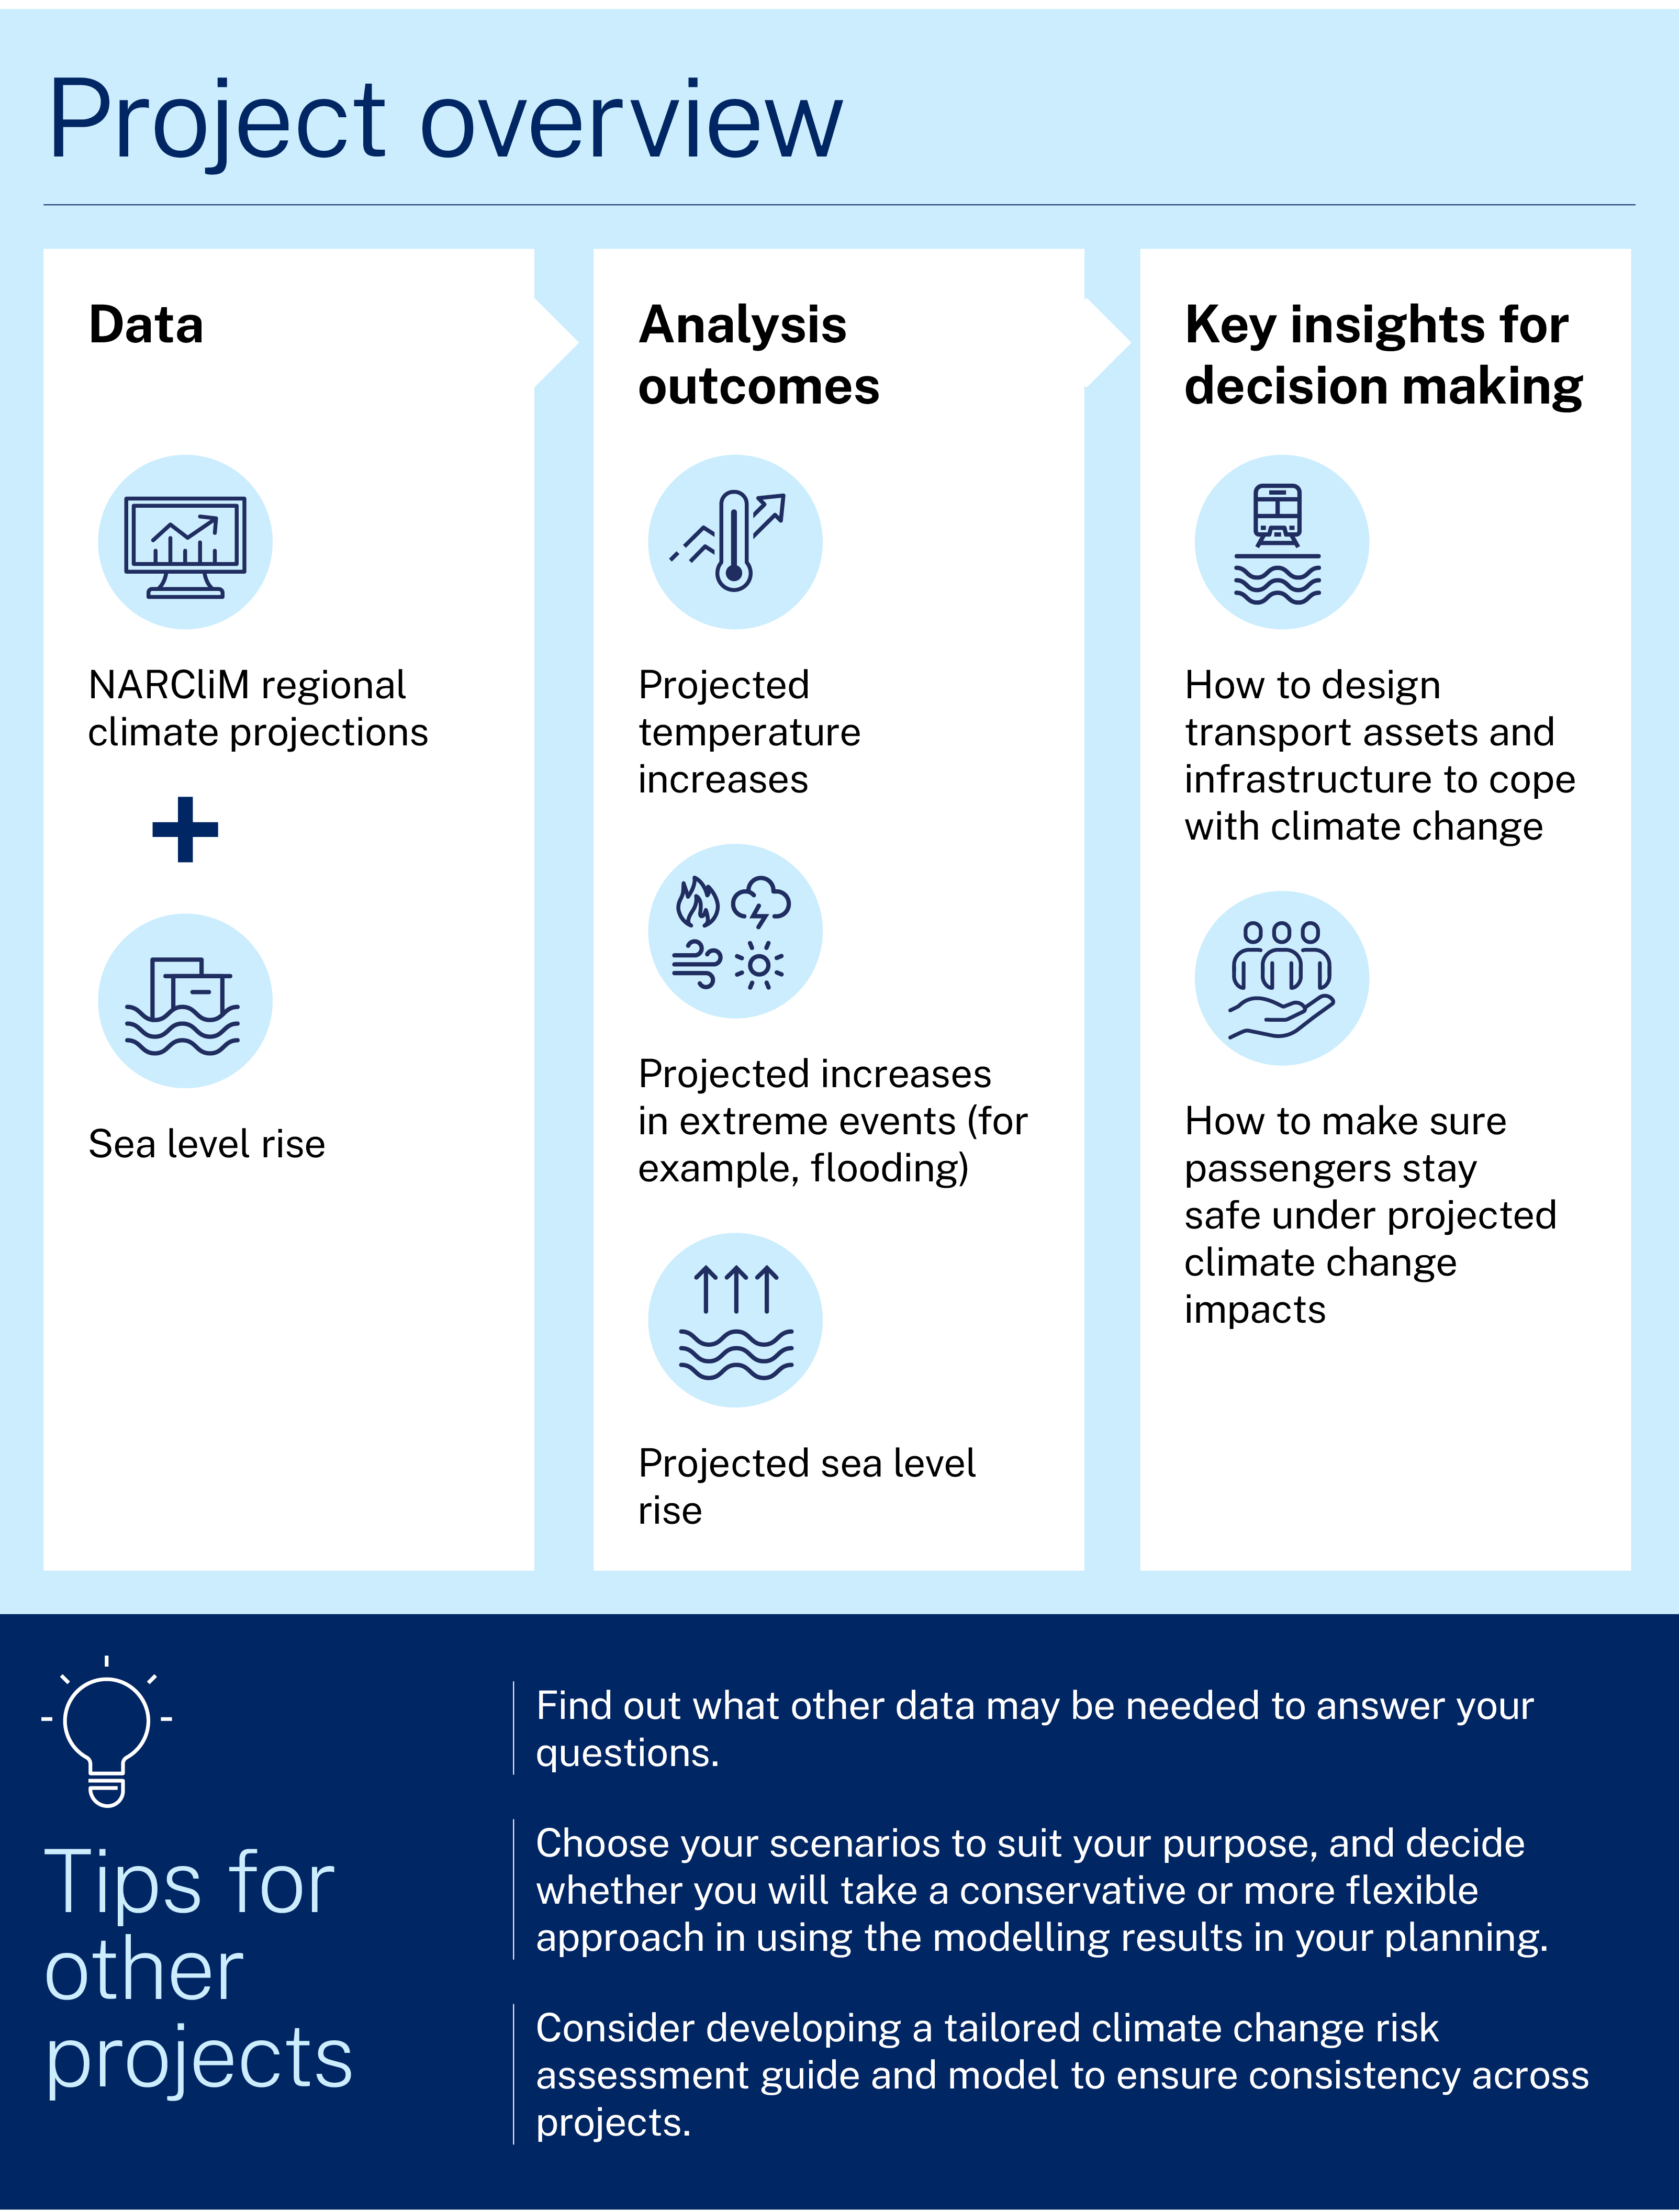
Project and outcomes
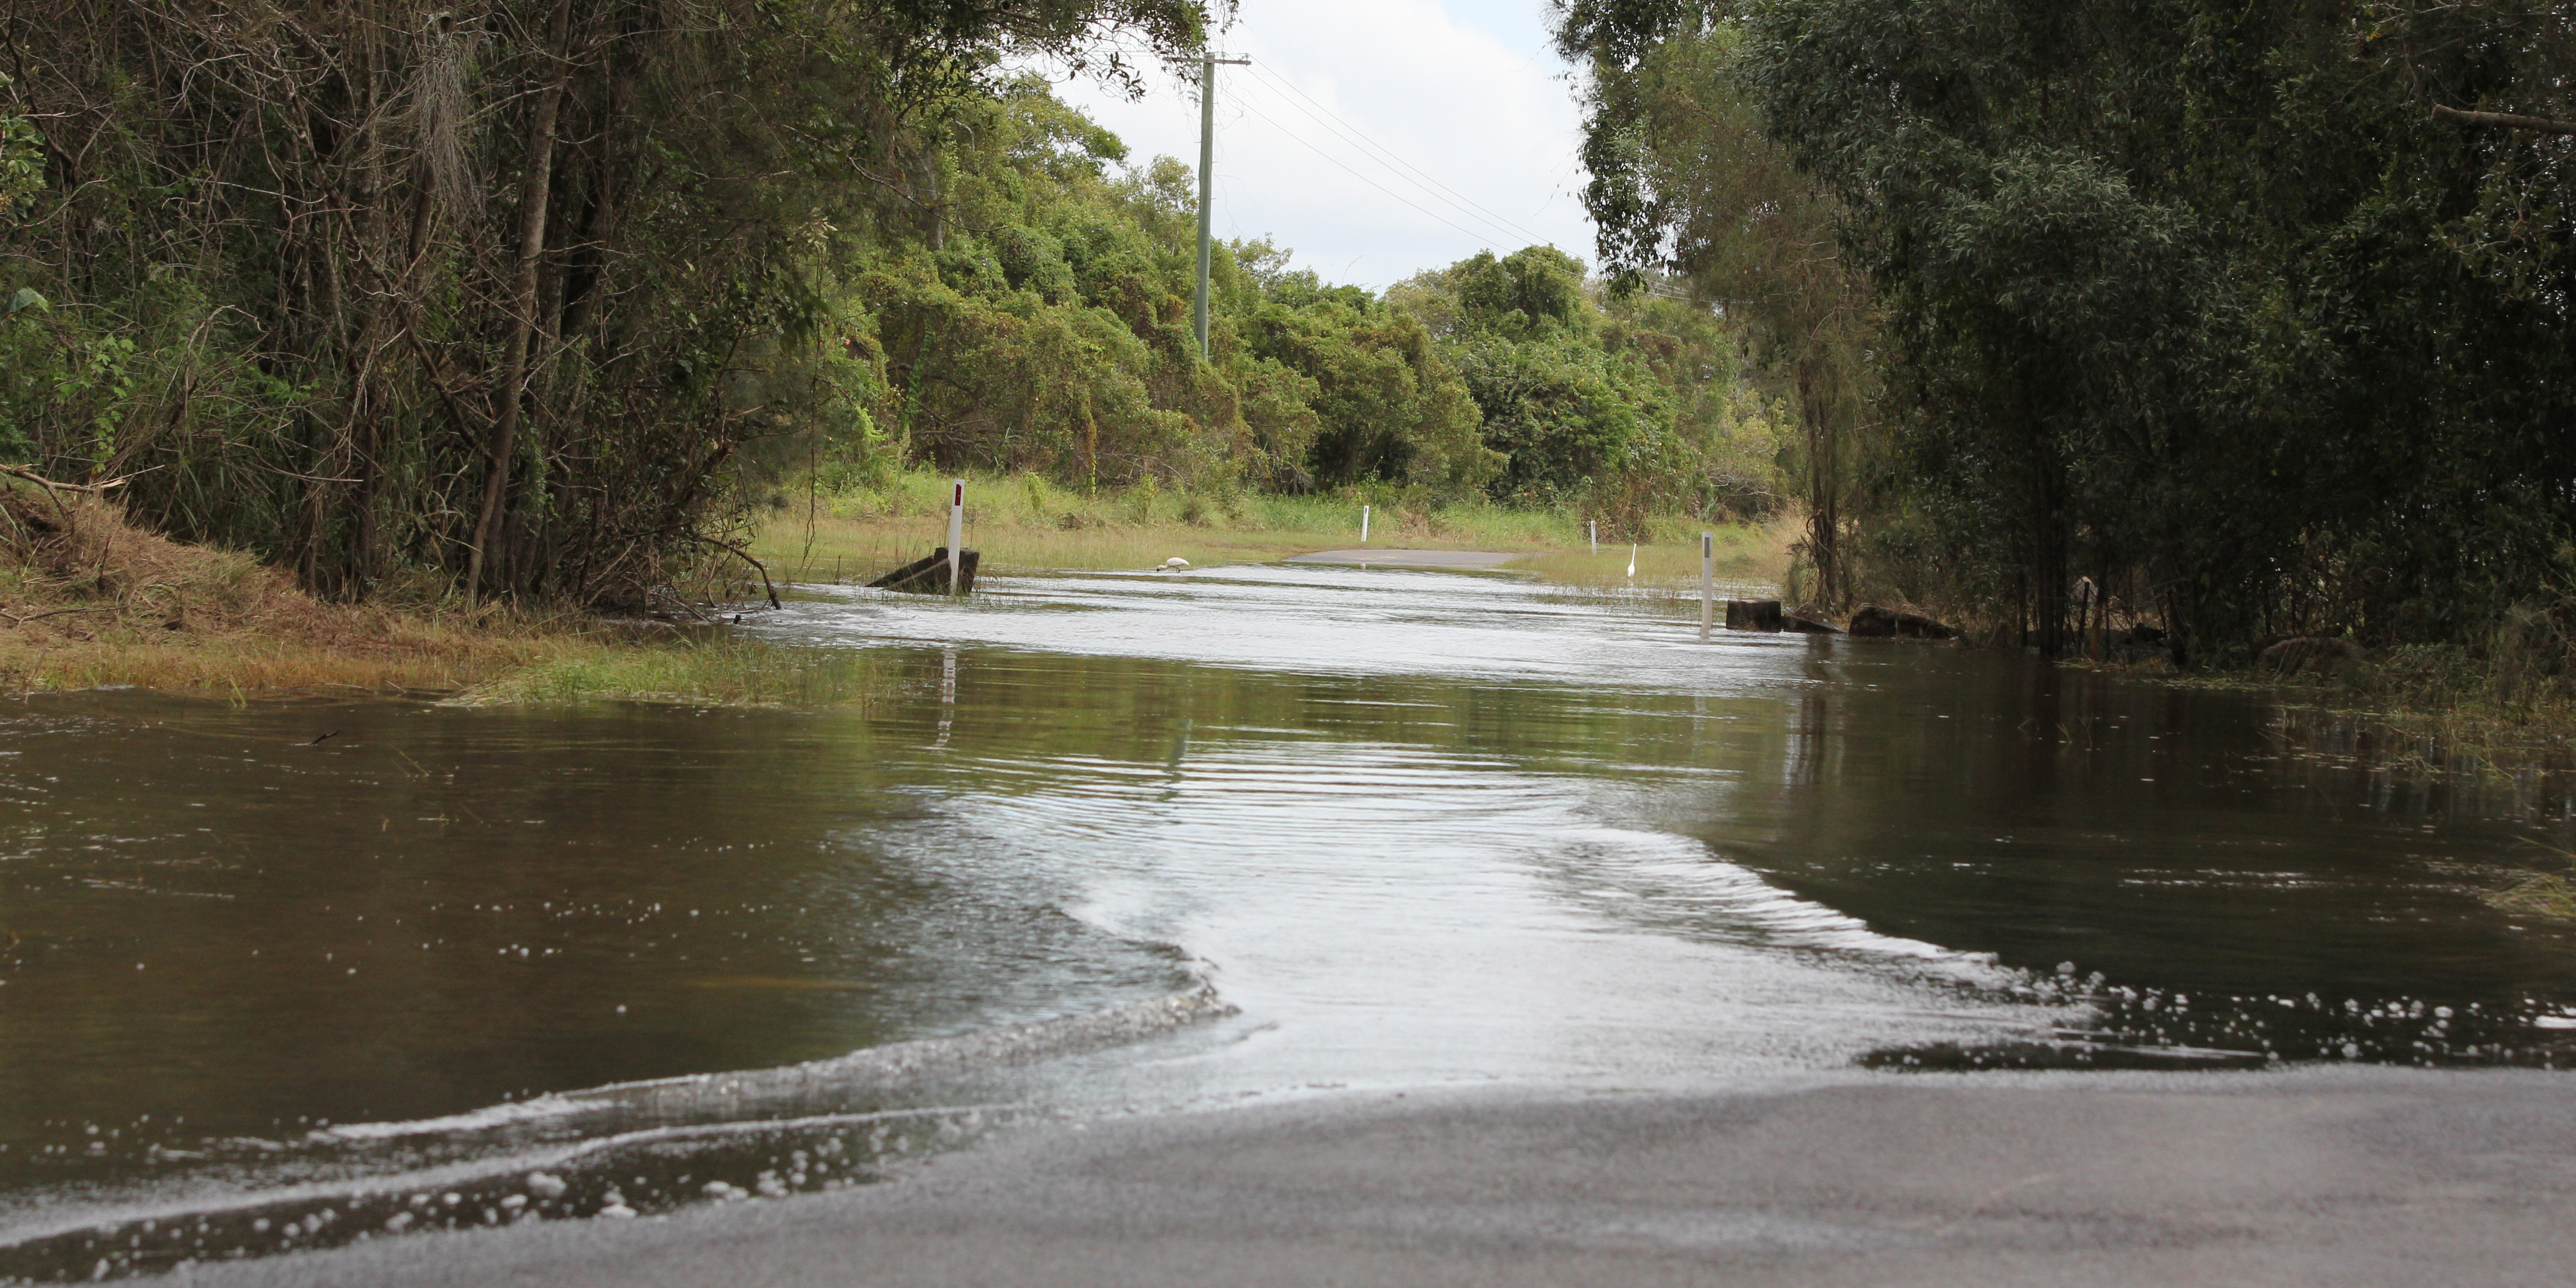
The most obvious impact on transport from climate change comes from extreme events. Chris says:
Transport is massively affected by extreme weather - large areas of our network can be enormously impacted by floods, fires, extreme temperatures, lightning, high winds and other natural hazards. So, increases in the frequency and severity of events with climate change will have far-reaching effects.
For an example of the dollar value of this, the damage to infrastructure caused by recent flooding in NSW was in the billions of dollars. And this doesn’t necessarily take into account any lost revenue, the cost of alternative service provision, delay costs or costs to customers. So, we need to design and build assets and systems, and embed processes, that enable more resilience to these types of events.
But Chris explains that their planning needs to encompass more than the impacts of extreme events, because climate change impacts will be felt across their operations. He says:
Every aspect of climate change will affect NSW transport. For example, we need to monitor the tracks on our rail networks, to ensure that they will cope with the significant temperature differentials between day and night in certain geographic regions, and consecutive days of extremely high temperatures. For our roads, we need the right asphalt types to be temperature and fire adapted, and to ensure that our drainage systems are designed and maintained for flooding events.
Our communications and control infrastructure needs to cope with high temperatures, fire, flood and winds. We need to look at vegetation management around transport corridors to manage fuel load and regrowth, to minimise the risk of fire.
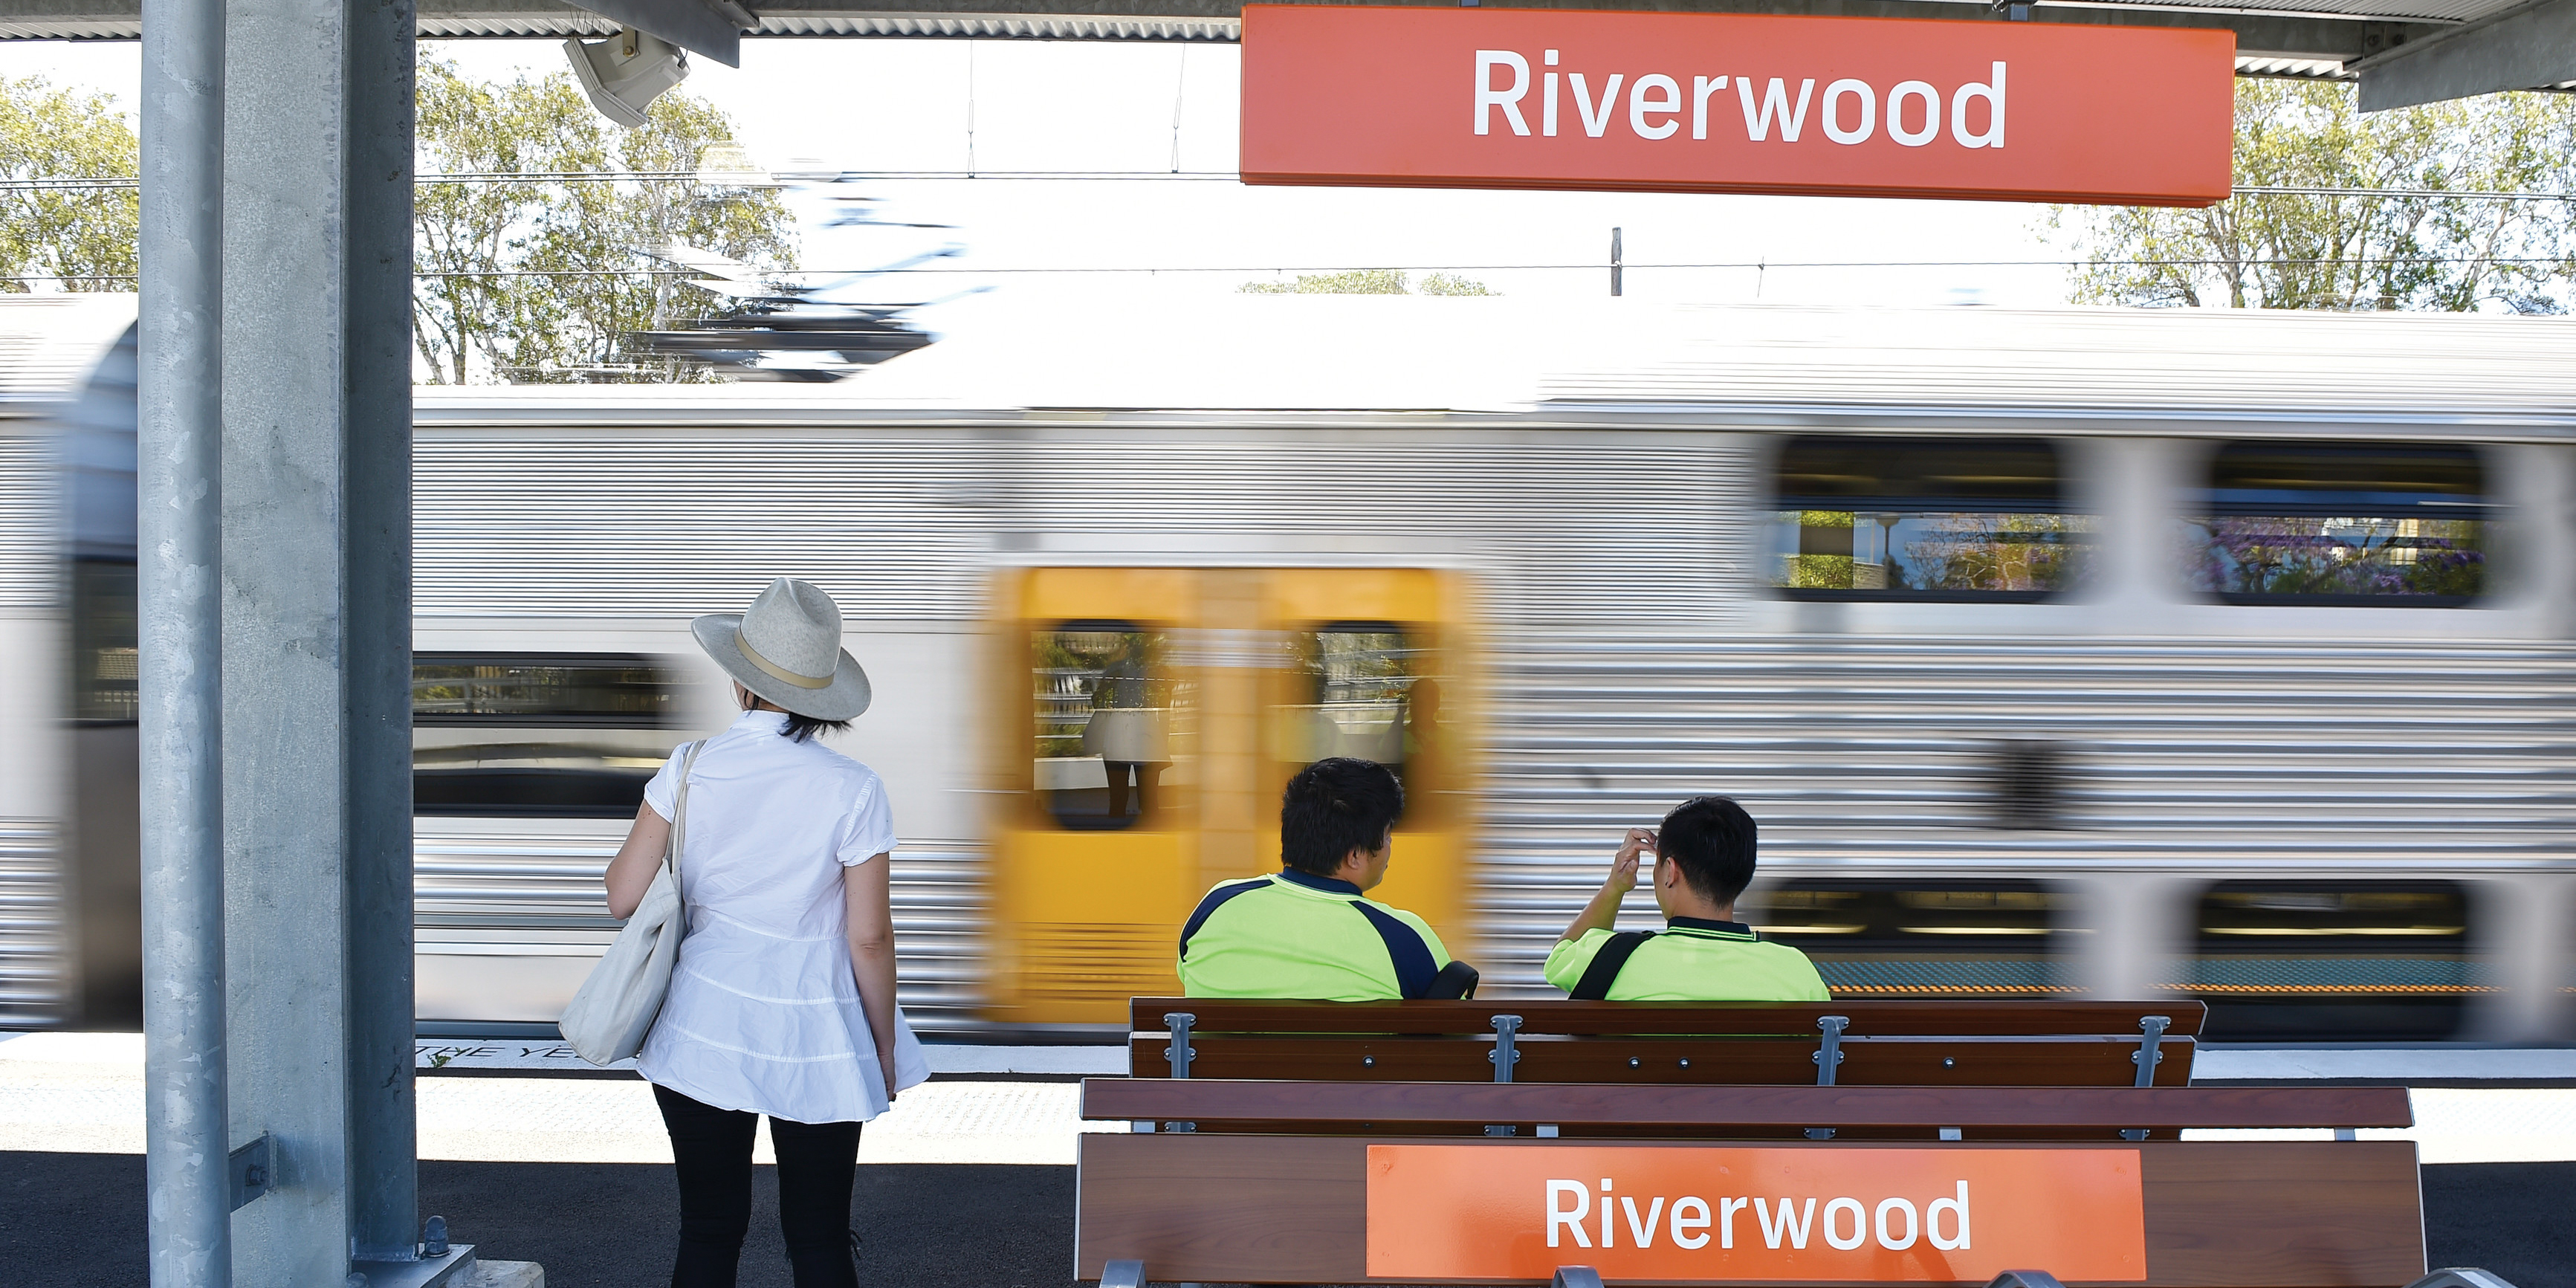
We need to protect passengers from extreme weather events, including heat. For air conditioners in buses and trains, hotter days will mean higher loads on the systems. When there is heavy rain, we may need better ways to prevent slips and falls at stations. We also need to consider passenger comfort and may also need to identify climate refuges and provide water for passengers.
We are transitioning away from a reactive, short-term approach to a longer-term, strategic planning process. Effective climate risk assessment means we can make smart decisions for the longer-term.
NARCliM provides a key resource for their climate risk assessments. Chris explains its role in the work:
NARCliM is seen as the ‘go to’ portal in NSW for climate projections. It is our most trusted tool. NARCliM was used to develop our Transport for NSW climate change risk assessment guide and model, which combines 6 raw climate projection data ensembles from NARCliM1.5, together with parametrisation and optimisation algorithms to assess multiple climate change projections for any selected geographical location. The model produces a database with climate projections for various sites that is displayed in a transport climate tool.
The model was peer-reviewed by the NSW Department of Planning and Environment and can be used to produce projections and provide preliminary assessments for specific regions and assets. To date we have used climate-risk assessment in many major projects, and are looking to apply it to all suitable projects going forward.
The team also uses other data, particularly because some transport assets have a longer lifespan than is offered by NARCliM's climate projections, and alternate climate variables are required to conduct a risk assessment.
Chris says that the outcomes from climate risk assessments are applied in different ways, depending on the asset type, project value, location and several other variables:
Our planning processes are complex because we have a huge array of assets across NSW - rail, road, maritime, ferry wharves, airports, light rail and others - and climate change affects different assets in different ways. In addition, the different baseline conditions and resources across the state mean that we can’t address everything in the same way. We have to tailor our response depending on the asset, where it is, how it will be affected by climate change, and what resources we have available.
Learnings and considerations
For Transport for NSW, NARCliM is the first port of call for climate projections, but not the single source of truth. The team needs other data – such as sea level rise projections – and they generally access climate projections from multiple sources. For example, the Transport for NSW model also includes the latest sea level rise projections from Climate Analytics, and identifies whether a location sits near the coastline. It also provides data about the urban heat island effect and various resilience indicators such as heat vulnerability index and disaster resilience.
Transport for NSW has also found that the fixed time brackets of NARCliM1.0 and the timescale of NARCliM1.5 did not extend as far into the future as required for planning. This makes it difficult to match the projections to asset life - some projects are currently evaluating projections out to 2150, based on 120-year design lives.
Chris found that using the NARCliM data required a lot of decision making, both about the scenarios and variables to be used, and the resulting implications for planning.
We are having to make a lot of decisions about which scenarios are used and how the projections are applied.
NARCliM results produce a value range. This is extremely reasonable based on the way climate models are developed and the probability distribution of values, but our engineers don’t necessarily want information to be presented in that way - they want an exact design threshold or specific value to design to. We have to refine and interpret the projections in a transport context, and then try to apply that to the engineering decisions.
The different needs and approaches taken by Chris’s team and climate scientists highlights the need to find the ‘middle ground’ to understand the data needs of the project. Chris’s team has a reasonable level of climate change maturity and expertise and could make appropriate decisions around which data to use. However, he emphasises that more specific guidance would improve how his team applied the data.
Chris appreciates that the model provides the local detail needed for planning. He also looks forward to higher spatial detail in future NARCliM generations. NARCliM2.0 is currently in development and will provide resolution to 4 km over southeast Australia. He says:
The GIS [Geographic Information System] mapping is very helpful for looking at your location, and the regional detail is much better than with other models. High-resolution information for individual assets such as a particular road, signal, intersection and rail assets would allow us to deal with highly localised factors in our planning.
Case studies
NSW councils are building climate risk into their business-as-usual planning and policies for the first time, thanks to products developed using NARCliM’s locally relevant climate modelled data.
Learn how NARCliM climate projections are being used by various NSW sectors to understand and adapt to climate change.