Key points
- A climate system model, also known as a global climate model, is a computer simulation of our global climate system that is built using real data.
- Global climate models use mathematical equations run on super computers to represent the processes and interactions that drive the earth’s climate. They use similar physical principals to weather forecasting, only the focus is on longer time scales such as years and decades.
- Global climate models are used to understand changes to the earth’s climate system as a result of anthropogenic activities such as the burning of fossil fuels.
- The information generated from the models helps us understand our climate and how it might respond to future changes – helping local government and communities to plan and adapt to climate change.
- The NSW Government has invested in an integrated climate science program including the delivery of fit-for-purpose and targeted regional climate projections for NSW through NARCliM (NSW and Australian Regional Climate Modelling).
What is climate system modelling?
Climate system modelling uses computer code to create a virtual Earth. This computer code (global climate model) captures our scientific understanding of how the Earth’s climate system works. These models take years to develop, and the result is a model of the global climate system that is detailed, but still less complex than the real climate system.
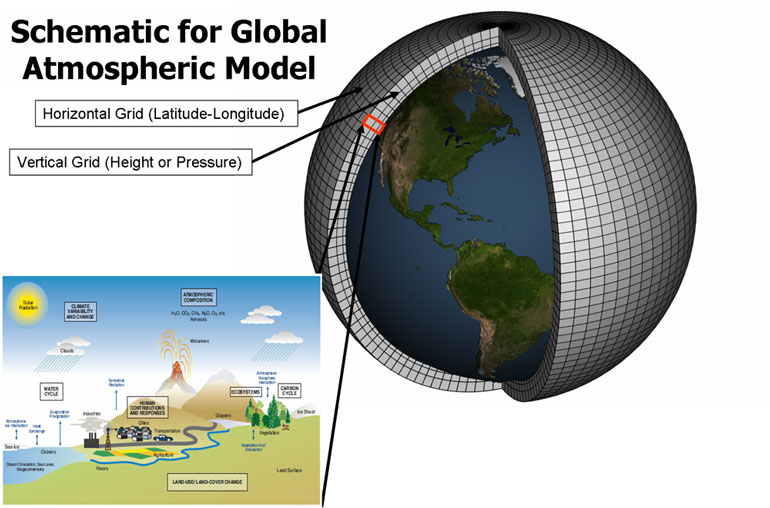
Illustration of grid cells used by climate models and the climatic processes that the model will calculate for each cell (bottom corner). Source: NOAA GFDL
Global climate models (GCMs) are developed, and constantly being refined, at climate modelling centres around the world. These are mainly in the northern hemisphere and include the Met Office Hadley Centre in the UK, and the NOAA geophysical Fluid Dynamics Laboratory in the US. In Australia this is carried out by CSIRO and BoM.
GCMs work by dividing the global climate system into three-dimensional boxes, or grid cells, of different sizes. This division occurs both horizontally (like the pages of a street directory, or lines of latitude and longitude) and vertically (from the land surface up into the atmosphere and down to the bottom of the ocean).
Horizontal grid cells are typically 100 to 250 kilometres across, whereas vertical grid cells correspond to known layering of the atmosphere or ocean. These models calculate winds, heat transfer, radiation, relative humidity, and surface hydrology within each of these grid cells, and evaluate interactions with neighbouring cells.
For this reason, the Coupled Model Intercomparison Project was developed. CMIP is a framework for climate model experiments, allowing scientists to analyse, compare and improve GCMs in a systematic way.
The Intergovernmental Panel on Climate Change (IPCC) uses CMIP to gather and review global climate models. Models are collected into sets and used, for example, to inform the IPCC’s assessment reports capturing the latest climate change information.
The availability/timeline of GCMs supplied through each CMIP phase varies, and not all GCMs are available at the same time.
The sets include:
- CMIP3, which informed the IPCC’s Fourth Assessment Report (AR4), released in 2010
- CMIP5, which informed the IPCC’s Fifth Assessment Report (AR5), released in 2014
- CMIP6, which is informing the IPCC’s Sixth Assessment Report (AR6), released in 2021.
Model inputs
The main inputs into global climate models are the external factors, also known as forcings, that change the amount of the sun’s energy that is absorbed by the Earth, or how much is trapped by the atmosphere. These include the amount of the sun’s energy that is absorbed by the Earth, greenhouse gases and aerosols. More information on forcings can be found on the global climate system page.
Model processing
These forcings are run through the model either as a best estimate of past atmospheric conditions, or as part of future greenhouse gas emission scenarios. These are potential pathways for the concentration of greenhouse gases in the atmosphere, based on how technology, energy and land use change over the centuries ahead.
Model outputs
GCMs produce outputs for each grid cell, such as temperature, precipitation, pressure, humidity and wind speed. Because each grid cell is a three-dimensional cube, this information is produced at points both across the earth, as well as for the different layers of the atmosphere – from the surface of the earth to the stratosphere. The climate can be modelled as it evolves over periods of time, which is why GCMs are sometimes known as ‘dynamical’ models.
These model outputs are often referred to by scientists in different ways. When modelling past climate they can be called climate re-analyses and when looking forward at the future climate they can be called climate projections and appear as large numerical text files. The data can then be used by specialised scientists in other types of numerical models to create further outputs. For example, projected rainfall data can be used to understand how water availability will change into the future.
GCMs are useful tools to understand our climate and climate change. The data we use to produce the models are based on a rigorous scientific process. But it is important to remember that the model cannot account for the factors that we do not yet understand, such as how quickly we will reduce our greenhouse gas emissions.
- Models also cannot provide detailed date information about events in the future. For example, the projections cannot have month to month or year to year correlation, or simulate the occurrence of a specific observed event (e.g. bushfire) on some given date in the future.
- Different models also use different types of data. Data may be collected from different sources, locations and time periods. Models may also use different combinations of equations. These differences can produce different results for the same greenhouse gas emissions scenario.
- Models make different approximations and assumptions for things that are quite hard for models to get right, like clouds, for example.
- Another source of uncertainty is the natural variability and fluctuations of the climate itself. This can be difficult to model.
How climate system modelling helps us
Modelling the climate system helps us understand how the climate changes over time and what might cause it to respond to different factors. These factors include:
- the complex relationship between atmospheric physical and chemical processes, and the biophysical conditions of the land and oceans
- volcanic eruptions, which can affect the amount of light and heat reaching the Earth’s surface
- increased greenhouse gas emissions, which affect average global temperatures
- changes to land use, such as clearing vegetation or increased human-built environments.
The results from these models provide the information we need to adapt to our changing climate. For example, models provide information such as potential changes in water availability and extreme heat to support decisions on things such as:
- managing our natural resources
- protecting threatened habitats and species
- planning future agriculture and urban developments.
The more information we have, the better we can plan and adapt.
Modelling the NSW climate
The coarse resolution of global climate models limits their use at the local level, as the grid cells are too large to accurately capture regional geographical features and processes. If the average grid size of global climate models is 200 kilometres, then the entire coastline of NSW, approximately 2,000 kilometres, would be represented in just 10 cells.
Just as you adjust the lens of a camera to refine an image, this problem can be overcome through dynamical downscaling, which means taking the information from a global climate model and improving the resolution.
There are two different ways of downscaling. Statistical downscaling uses the existing relationships between local observations and large-scale climate features, and it applies these relationships to projections from GCMs. The benefit of this method is that it requires relatively small computing resources. However, the method assumes that the relationships between large-scale and local climates will not change in the future.
The second method is dynamical downscaling which uses high-resolution regional climate models (RCMs). These are built by using the same principles as GCMs but contain additional information about a range of factors (such as topography) that are important in determining regional climate. Because they are built on physical principles, dynamical RCMs allow for changes in the existing relationship between weather variables and climate drivers. Dynamical models create a new time series, rather than adjusting an existing one.
NSW and Australian Regional Climate Modelling (NARCliM)
The NSW Government leads dynamically downscaled climate modelling for NSW through the NSW and Australian Regional Climate Modelling (NARCliM) project.
NARCliM produces regional climate projections that are much higher in resolution than global climate models. This means it can better consider factors relevant to NSW’s geography and finer scale processes in the atmosphere that drive important weather systems. The result is that the NARCliM project produces locally relevant data for state and local planning and decision-making.
With the first generation of climate projections released in 2014, NARCliM has already informed major strategic planning initiatives such as the NSW State Infrastructure Strategy (2022–2042), Future Transport Strategy and NSW Water Strategy.
The NSW Government is committed to ensuring our state has access to the latest climate information. NARCliM continues to enhance and refine the available climate information, with new generations being created in response to the latest available science, including advancements in global climate models. Find out more about NARCliM and how its data can be used.
Related information
Today's weather forecast: Good with a strong chance of improvement - EARTH, The Science Behind the Headlines
Uncertainty and confidence in projections - Climate Change in Australia
Climate Modelling – NOAA Geophysical Fluid Dynamics Laboratory