
Mental Health Support
Climate change information can be distressing for some readers, with many Australians of all ages experiencing significant eco-anxiety. For supporting information, please visit the Black Dog Institute or Australian Psychological Society or speak with your local healthcare provider.

The Projections
Compared to a baseline climate for the period between 1990-2009, NSW is expected to experience average warming of:
1.2°C by 2050, and 1.3°C by 2090 under a low-emissions scenario
1.6°C by 2050, and 2.7°C by 2090 under a medium-emissions scenario
2°C by 2050, and 4°C by 2090 under a high-emissions scenario.
The difference between these futures reminds us of the importance of local and global efforts to reduce greenhouse emissions and reach Net Zero by 2050.

Overall, increased warming will lead to:

In translating the climate projections, it is important to consider the historical changes before the 1990-2009 baseline.
For example, our national temperature observations indicate NSW has warmed by 0.84°C between 1910-1930 and the baseline period. The 1990-2009 baseline period was selected to be consistent with previous generations of NARCliM (1.0, 1.5).
Watch navigating NARCliM on AdaptNSW
Learn about the data, including how to access and use it through new content and resources.
Discover localised projections
In NSW, climate change impacts vary by area. NARCliM2.0 provides detailed projections for each region to assist in future planning for government, businesses and the community. You can access these projections, including temperature and rainfall changes, through online tools like the regional climate change snapshots or the interactive climate change projections map.
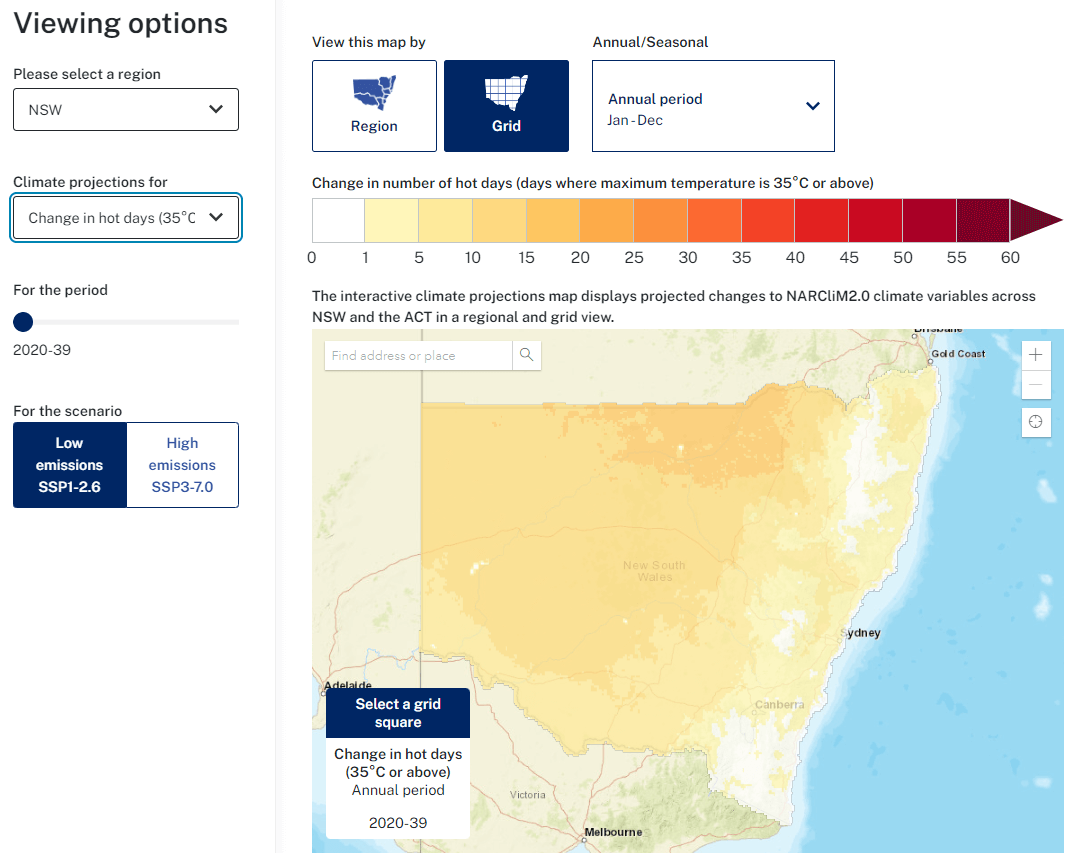
Explore climate projections for core variables (such as temperature and rainfall) at a 4km resolution across NSW
Climate change snapshots provide a concise presentation of the latest climate projections and are provided to cover NSW, the ACT, and 10 NSW planning regions.
AdaptNSW provides supporting information and resources to increase end-user understanding and application of NARCliM regional climate projections.

Mental health support
If you're feeling anxious about climate change, our page on navigating eco-anxiety is a useful resource to help understand the emotions you're feeling.
NARCliM2.0 projections provide detailed insights into how NSW communities, built and natural environments will continue to be impacted under future climate change. This information can be used to assess risk and take action to reduce the impacts of climate change.
How are government agencies using NARCliM?
Since the first generation of NARCliM was released in 2014, it has become the ‘go to’ source of climate information for government agencies in NSW. Leveraging the experience of a selection of our end-users, we have captured learnings and insights in a suite of case studies. Building on this, we also have available a series of video case studies that highlight the journey of end-users across sectors as they work towards effectively applying the NARCliM data for a range of climate adaptation planning.
Climate change creates a significant risk to infrastructure, people, and the economy. The impacts from climate change, including damaging weather events, has already cost the state an estimated $3.6 billion per year.
The role of the Greater Cities Commission is to coordinate and align the planning that will shape the future of the Six Cities Region.
NSW councils are building climate risk into their business-as-usual planning and policies for the first time, thanks to products developed using NARCliM’s locally relevant climate model data.
Explore NARCliM2.0 resources for:
Did you know that depending on where you live, the impact of climate change may differ? Whether you own a property or just want to find out what climate change may mean for your neighbourhood or region, NARCliM2.0 data can help you prepare. This could range from assessing risks to current property, understanding insurance requirements, or making informed decisions about where to relocate or build a new home.
Discover how climate change is impacting your local area with the My Region page and interactive climate change projections map. Take action with information and resources provided on the How to Adapt for Households suite of pages.
Community groups are at the heart of the health and resilience of many local communities. If you're a member of a group looking for information to help you make secure and confident decisions in the face of climate change, NARCliM2.0 data can help. This may include arming your community with knowledge to plan for extreme weather, build compelling cases for advocacy and support, and prioritising community safety for the future.
Discover how climate change is impacting your local area with the My Region page, interactive climate change projections map and the regional climate change snapshots. Take action with information and resources provided on the How to Adapt for Community groups suite of pages. You can also check out our IRCC community group grants and see how local community groups have been adapting to specific climate challenges in their region.
If you own or work at a SME, having accurate data to help make smart decisions is essential. Understanding the facts and figures around climate change helps you mitigate your risks, as well as influencing how and where to engage in business opportunities. Use the interactive climate change projections map and My Region pages to understand climate risk in your area of operation, and get industry specific guidance from the How to Adapt for Business suite of pages. After more specific information? Find recordings and deep dive articles on adaptation planning and a range of other topics through our Forum home page, or check out the online magazine we made specifically for the business audience for the 2023 Purpose Conference.
Many enterprises across the country are already considering the potential impacts of climate change on business, and adjusting their strategy. From supply chain resilience to operational efficiency and continuity planning, every decision should be backed by an understanding of climate risks and opportunities. NARCliM2.0 data can help you with just that – as well as support climate reporting.
Use the interactive climate change projections map and My Region pages to understand physical climate risk, and check out our How to Adapt page for Business. The AdaptNSW Forum has a suite of recordings that investigate and breakdown physical, transition and legal climate risk. The 2023 presentations included Navigating the brave new world of climate disclosure and Nature redefined and revalued: Is your company ready for the TNFD?. Further resources can be found on the online magazine we made specifically for the business audience for the 2023 Purpose Conference.
Local governments are always considering how to prepare their LGAs for the future, and this increasingly includes adjusting to the impacts of climate change. NARCliM2.0 data helps educate decision-makers on how to boost the resilience of cities and regions, as well as providing insights on how climate change projections can be integrated with critical service planning.
Use the interactive climate change projections map, My Region web pages and the regional climate change snapshots to understand how your region is projected to change into the future. We have a suite of web pages on How to Adapt for Local Government, as well as a specific climate actions for local government. The AdaptNSW Forum page has detailed content and recordings for local government, including on issues such as urban heat and adaptation planning. You can also check out our IRCC local government grants and see how local governments across the state are adapting to their specific climate challenges.
Staying informed with the latest data on climate change is essential to ensuring the state's readiness for changing conditions. NARCliM2.0 data provides department heads, strategic planners and climate risk officers critical evidence for environmental planning, building transport resilience, assessing climate impacts on the economy and planning for climate-resilient cities.
Use the interactive climate change projections map, the My Region pages, and the regional climate change snapshots, to understand how the climate may change across the state. You can also learn about NARCliM data and how to use the projections through our climate projections home page. Read our Climate Risk Ready guide and access other resorces for state government at our How to Adapt for State government page. You can also listen to a range of content on climate risk and adaptation planning through the AdaptNSW Forum home page.
Media and public discourse are increasingly considering the potential impacts of climate change on young and emerging generations – and educators are at the forefront of this discussion. NARCliM2.0 data helps educators develop teaching curriculums to upskill staff and students, providing the resources and tools needed to navigate this evolving landscape. Start with our Teacher Resources on Climate Change page which maps pages on AdaptNSW to the curriculum. Students can use the interactive climate change projections map and My Region pages to understand how the climate will change in their region - as well as dive into a range of climate science and adaptation content.
Researchers rely on accurate climate data to bolster recommendations in their field. NARCliM2.0 data can be utilised to inform scientific hypothesis and testing, generating insights for report writing and policy, as well as creating new tools and products to progress climate change research. Access detailed resources on the NARCliM methodology and how to use NARCliM data from our climate projections home page. The NSW Climate Data Portal will be updated in the coming weeks. Sign up to our newsletter to be the first to know when it goes live.
Aboriginal people are the first Astronomers, Scientists and Adaptation specialists.
Australia’s First Nations people have lived in NSW for over 60,000 years and have significant spiritual, cultural and economic connections with its lands, waters, seas and skies. They are the first astronomers and scientists who have been listening to and caring for Country for generations.

In spring 2023, 60 Worimi people, led by Aunty Michelle Perry, gathered for what is believed to be the first Community-led cultural burn in Barrington Tops since colonisation.
Climate change is a Dreaming story that we have co-created, Gamilaroi woman Paris Norton told the AdaptNSW 2022 Forum.

Aboriginal people have been using generational knowledge of land and sea management in response to changing climates over thousands of years.
NARCliM2.0 has adopted the latest global greenhouse gas emissions scenarios from the Intergovernmental Panel on Climate Change (IPCC) Sixth Assessment Report.
These include a low (SSP1-2.6), medium (SSP2-4.5) and high (SSP3-7.0) emissions scenario.
The projections highlight the stark difference in climate change impacts that can be experienced between the low, medium and high-emissions scenarios. This illustrates just how important it is to take immediate action to reduce emissions.
Developing NARCliM2.0
To develop the next generation of NARCliM data, our climate scientists have drawn on the latest available science used in the IPCC Sixth Assessment Report.
NARCliM2.0 uses advanced regional climate modelling techniques, and global climate models and emissions scenarios from the latest Coupled Model Intercomparison Project - Phase 6 (CMIP6).
The development of NARCliM2.0 represents the most computationally intensive generation of NARCliM to date. NARCliM2.0 data have been through almost 3 years of processing thanks to a collaboration with Canberra’s National Computational Infrastructure, one of the Southern Hemisphere’s most powerful supercomputers.
Producing NARCliM data is an iterative process. There are 3 generations of NARCliM data available, NARCliM2.0 (2024), NARCliM1.5 (2020) and NARCliM1.0 (2014). Each generation responds to changing end-user needs and incorporates the latest available science.

The development of NARCliM data follows a rigorous process and procedure for creating scientifically robust, fit-for-purpose regional climate data.
NARCliM is the NSW Government’s recommended source of climate projections for NSW. Each generation of NARCliM contains multiple sets of projections, and it’s important to understand the differences between the generations and know which to use.
Sign up for the AdaptNSW newsletter
The AdaptNSW newsletter covers the latest research, events, publications, grants and news. The newsletter comes via email each quarter, and you can opt out at any time. Your details are not shared with any third-parties.