
Key points
- NARCliM is an iterative project, regularly releasing new climate projections built from the latest available science and climate models.
- There are currently 3 generations of NARCliM data. NARCliM2.0 (SSP1-2.6 and SSP3-7.0 released in 2024, SSP2-4.5 released 2025), NARCliM1.5 (released in 2020) and NARCliM1.0 (released in 2014).
- There are significant advancements in the models underpinning NARCliM2.0, such as improved accuracy and resolution compared to NARCliM1.0.
- The key trends/patterns across NSW are similar between generations, especially for temperature which is the most robust indicator of climate change.
- It’s important to know when to use NARCliM over other sources of climate data, and which NARCliM generation and parameters to use.
NARCliM climate projections
NARCliM is the NSW Government’s recommended source of climate projections for NSW. Each generation of NARCliM contains multiple sets of projections, and it’s important to understand the differences between the generations and know which to use.
Other sources of climate projections are also available. For example, in addition to NARCliM, there are 2 other major initiatives underway to produce the latest generation (CMIP6) of downscaled climate projections in Australia:
- Australian Climate Service (CSIRO-BOM)
- Queensland Future Climate Program (Queensland Government)
Each source offers a consistent approach to projections across Australia, making them suitable to compare climate effects across different parts of the country. NARCliM also offers projections for the wider Australasian region (although the NARCliM national-scale data are at a coarser resolution than the data it provides for NSW and south-eastern Australia).
Before you use any climate projections, make sure you’re familiar with both their offerings and limitations.
Choosing the generation of NARCliM
Since 2014, 3 generations of NARCliM data have been released. The latest generation, NARCliM2.0, has had the benefit of several design enhancements, was able to leverage on recent technical and computational improvements.
When selecting climate projections, the latest available generation of NARCliM data is recommended for most uses. For example, you can use NARCliM2.0 as a basis to:
- assess climate risk
- make planning and development decisions
- update policy
- future-proof infrastructure and businesses.
However, each new generation of NARCliM does not aim to replace previous generations. For example, the high-emissions scenarios SRES A2 (used in NARCliM1.0) and RCP8.5 (used in NARCliM1.5) remain consistent with other models for the near future (next 20 to 30 years) and can be useful for planning purposes within similar timeframes.
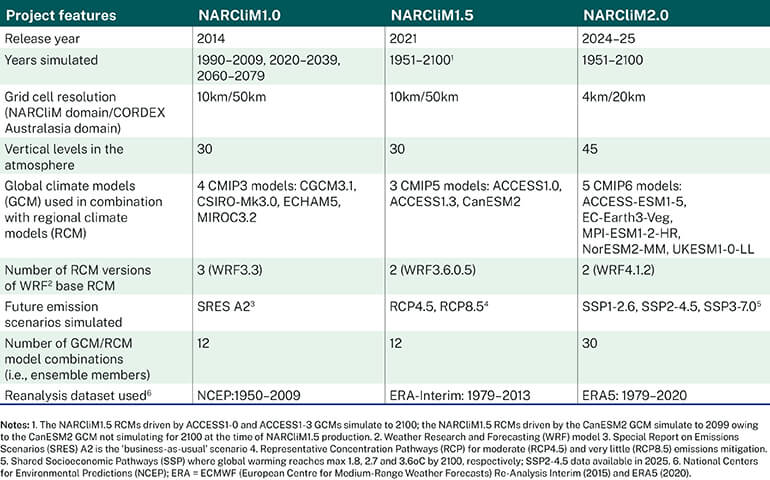
Together, all 3 NARCliM generations capture a greater range of plausible future climates than each individual generation does, and should be used together to achieve a more comprehensive range of plausible future climates. Table 1 provides a summary of specifications for each generation.
NARCliM2.0 is publicly available for download through the NSW Climate Data Portal.
NARCliM generations
- Time periods: 1951–2100 (continuous)
- Grid cell resolution: 4km for south-eastern Australia (NARCliM domain), 20km across the Australasian region (CORDEX domain)
- GCMs: 5 CMIP6 models
- RCMs: 2 WRF base RCMs (WRF4.1.2)
- Emissions scenarios: SSP1-2.6 and SSP3-7.0 (released 2024); SSP2-4.5 (released 2025)
- Total datasets: 30 GCM, RCM and emissions scenario combinations
- Released in 2021
- Time periods: 1951–2100 (continuous)
- Grid cell resolution: 10km for south-eastern Australia (NARCliM domain), 50km across the Australasian region (CORDEX domain)
- GCMs: 3 CMIP5 models
- RCMs: 2 WRF base RCMs (WRF3.6.0.5)
- Emissions scenarios: RCP4.5 and RCP8.5
- Total datasets: 12 GCM, RCM and emissions scenario combinations
Technical note on the time period for NARCliM1.5: one of the GCMs used in NARCliM1.5 only simulates to 2099. This means that projections for the year 2100 are less robust than projections to the year 2099 (which are averaged from all 3 GCMs).
- Released in 2014
- Time periods: 1990–2009, 2020–2039 and 2060–2079
- Grid cell resolution: 10km for south-eastern Australia (NARCliM domain), 50km across the Australasian region (CORDEX domain)
- Global climate models (GCMs): 4 CMIP3 models
- Regional climate models (RCMs): 3 Weather Research and Forecasting (WRF) based RCMs (WRF3.3)
- Emissions scenario: SRES A2
- Total datasets: 12 GCM, RCM and emissions scenario combinations
NARCliM2.0 is currently the only set of regional climate projections offering the high resolution of 4km across south-eastern Australia. This is an increase from the 10km scale offered by NARCliM1.0 and NARCliM1.5.
NARCliM2.0 also offers more climate variables and multiple scenarios. Approximately 150 climate variables are available with NARCliM2.0, including core variables such as temperature, precipitation, humidity and wind.
Just as for NARCliM2.0, NARCliM1.0 and 1.5 were designed using robust scientific methods. As such, they represent the best modelling available at the time they were produced. Any scientific research conducted using earlier generations of NARCliM is still valid today.
It is important to note that although NARCliM2.0 presents significant improvements to the underlying climate models used, there are similarities in the configuration and underlying trends shown in the climate projections of each generation of NARCliM. For example, the future climate projected for NSW by NARCliM2.0 is drier and hotter than the future climate projected by NARCliM1.0. However, the key trends/patterns across NSW are similar between generations, especially for temperature which is the most robust indicator of climate change.
Choosing NARCliM data parameters
Each generation of NARCliM contains multiple projections datasets, based on the different combinations of parameters:
- climate variables
- spatial extent
- time periods
- emissions scenarios
- GCMs and RCMs
- NARCliM data outputs.
Choose the projections that answer the questions and challenges for your project . Consider your project needs and desired outcomes when choosing NARCliM generations and parameters.
NARCliM data parameters
NARCliM provides data for various climate variables including temperature, humidity, air pressure, wind, solar radiation, soil moisture and precipitation. In addition to standard climate variables, each generation of NARCliM considers which variables are most useful to end-users (as identified during the codesign process) and may include new variables as a result. For example, NARCliM2.0 offers 15 core variables (approximately 150 variables in total) compared to 11 core variables available in NARCliM1.0.
The variables you choose will depend on your project. If you are only interested in a single type of climate risk, you might only need to choose one or a few variables. However, if you are exploring multiple climate risks or the effects of combined risks, you might choose to analyse a wide range of variables.
Considerations for choosing climate variables
- Are you interested in a particular hazard? Then you might choose to, for example, run analyses for each combination of GCM, RCM and emissions scenario for the climate variables related to the hazard.
- Is your area or hazard of interest influenced by changes in other areas – for example, do you need to also analyse changes in upstream parts of your catchment or in surrounding regions?
- Be aware of bias corrected data for temperature and rainfall and understand if they are relevant for your project.
Find the variables for each generation through the NSW Climate Data Portal.
For local scale planning, you will usually want to use the dataset with the finest grid resolution. However, this should be balanced with other considerations, such as the use of multiple sets of projections (for example, using projections from all NARCliM generations to capture a greater range of plausible future climates). For projects focused on NSW areas, NARCliM2.0 is the recommended source, as it is built on the latest available climate models and processes, and provides a fine spatial extent of 4km across south-eastern Australia.
The area covered by the 4km scale is referred to as the NARCliM domain and includes NSW, the ACT and Victoria, and parts of Queensland, South Australia and the Northern Territory. For the wider Australasian region (known as the CORDEX domain), NARCliM2.0 provides a 20km scale. Both NARCliM1.0 and NARCliM1.5 provide data to a 10km scale across the NARCliM domain and to a 50km scale across the CORDEX domain.
Considerations for choosing spatial extent
- For local scale planning in NSW, the 4km resolution offered by NARCliM2.0 is recommended.
- If your project considers national-scale climate change, or compares climate risks across jurisdictions, you may choose to use the 20km scale or other sources of climate projections to ensure consistency.
Your choice of time period will depend on your project; however, it is recommended to assess at a 20-year time horizon to ensure inter-annual variability signals are not muting the long-term climate signals.
NARCliM2.0 and NARCliM1.5 provide continuous climate data for 150 years – from 1951 to 2100 (see NARCliM1.5 above for details on its time period). NARCliM1.0 provides climate data for 2 fixed time periods and a historical baseline.
Along with future projections, NARCliM provides climate model data for the recent past (known as hindcasts). These data are produced for each NARCliM dataset and are used in model evaluation and to help understand model bias. These data also have some uses in advanced data analysis, such as helping data users identify the most suitable set of NARCliM projections to use and to benchmark the degree of change between future projections and a period in the recent past.
Considerations for choosing time periods
- What time periods are most suitable for your project? For example, if you are assessing the impact climate change may have on major infrastructure, you might look at all time periods to cover the lifetime of the asset.
- Do you need to include a reference scenario in your analysis? For example, if you need to estimate the degree of change that may occur under a future scenario, since a particular period in time (or baseline), you may need to use model data of past climates as a reference.
Part of your decision on which generation to use will depend on which emissions scenario best meets the needs of your project.
NARCliM2.0 uses the most recent emissions scenarios adopted by the Intergovernmental Panel on Climate Change (IPCC) – known as shared socioeconomic pathways (SSPs). SSPs describe greenhouse gas emissions scenarios based on different climate policies and socioeconomic actions.
Comparing multiple emissions scenarios can help you explore a range of future climates. Within a generation, you can compare the projections of multiple emissions scenarios of the same type (except for NARCliM1.0, which only uses 1 scenario). For example, in NARCliM2.0, you may look at the projected climate for SSP1-2.6, SSP2-4.5 and SSP3-7.0. For a wider analysis, you may choose to look at all NARCliM generations. This approach can be useful to understand the range of plausible climates that we may experience, depending on our actions to reduce emissions.
Considerations for choosing emissions scenarios
- Does your project need to capture a broad range of future climates to assess the sensitivity to 2 or more scenarios? If so, use NARCliM2.0.
- Are you exploring ‘worst-case’ scenarios? You may decide to choose the highest emissions scenario.
- Do you want to capture the largest range of possible futures? If so, use as many emissions scenarios as you can, and even consider using different NARCliM generations.
Learn more about emissions scenarios used by NARCliM.
Each NARCliM dataset is the result of a combination of a GCM, an RCM and an emissions scenario. Scientists refer to this as a ‘model ensemble’. For example, NARCliM2.0 uses 5 GCMs, 2 RCMs and 3 emissions scenarios, resulting in 30 datasets (or model ensembles). Using the full range of datasets across the suite of generations will show an extensive range of possible future climates to better inform decisions and planning for the future.
The NARCliM modelling team have carefully selected the GCMs and RCMs as part of a robust development process. Part of the NARCliM process is to compute an average of these models for easier use. For non-technical users, this average (known as a multi-model mean or ensemble mean), along with the model spread (the range of conditions simulated by the chosen models), is leading practice and should be the first point of reference.
For more technical end-users, there are other considerations for model and dataset selection.
Considerations for choosing GCMs and RCMs for technical end-users
Generally speaking, the best approach for choosing GCMs and RCMs is to analyse each dataset (e.g. this may be comprised of the output from each RCM simulation, with each emissions scenario) and then determine whether you need to use all sets of projections in your project, or if just a subset is suitable.
For example, rainfall is more variable in the NARCliM projections than temperature, and for certain regions and periods, the models are in disagreement regarding the sign of the projected change. Projections of rainfall can still be useful, but their use must be adaptive and take into account this range of uncertainty. Where uncertainty is large, a simple average of plausible projections may not be adequate. For such cases, it is important to account for the range across models and emissions scenarios, and more detailed analyses may be warranted. Additional examples of applying NARCliM climate projections into practice, including identifying the most appropriate dataset for your work, are available through the Climate Change in Australia website
If you choose not to use all available datasets, make sure you communicate the reasons for this with your results.
- If comparing 2 or more emissions scenarios, the same GCM/RCM combination must be compared under each emissions scenario.
- Consider whether using different GCMs and RCMs is relevant to your project. You may run analyses using different combinations and find that there are no statistically significant differences.
- If you decide to only use a single projection dataset (only one GCM/RCM/emissions scenario combination), how will you communicate and justify your choice?
Learn more about the GCMs and RCMs used by NARCliM.
NARCliM data are available in its raw form, and as post-processed and bias corrected datasets.
Raw NARCliM data
In its raw form, NARCliM is too large to be used on standard desktop computers and laptops. Supercomputers are needed. Researchers can access the full raw NARCliM data through an account with the National Computational Infrastructure, whose high-performance supercomputers host NARCliM data.
Post-processed NARCliM data
NARCliM data produced by the modelling process is post-processed into manageable chunks for further use. This results in a selection of datasets – including data at sub-daily (1hr, 3hr, 6h), daily, monthly and seasonal averages – calculated from the NARCliM raw data outputs.
Bias corrected data
NARCliM bias corrected datasets have been developed for maximum and minimum daily temperature and daily precipitation. These variables are the most widely used in scientific research for exploration and model evaluation, and for deriving many metrics to characterise some physical climate hazards (such as extreme rain). No other NARCliM variables are available in bias-corrected formats.
Considerations for choosing data outputs
- For most purposes, using a bias corrected dataset is the most user-friendly choice.
- If you are conducting your own bias correction processes (and have the expertise and resources to use large datasets), you may want to use non bias corrected data.
Find more information on NARCliM’s data production, testing and validation.